Statistical Report on Montana 2020 Election Results
The graphs and maps for Montana counties and the state associated with this report are generated from government documents (US Census, MT Sec. of State, MT Public Health). Most of the graphs are just a pictorial representation of that data. Others are from calculations generated from the data.
When the data is presented in a graph, it can tell a story – a relationship between the numbers that may not be seen so easily by looking at the raw numbers. For instance:
Republican/Democrat Presidential Voting History 2004-2020

This type of graph is available in our graph section for National, State, and County results. They include only Republican and Democrat votes, not third-party votes.
The bars represent the total votes cast and the lines represent the respective Republican and Democrat portions of the total. So, what can you make of it?
First, notice the higher turnout in 2020 as compared to the previous four elections.
Second, observe the slope of the Republican and Democrat lines as you move from election to election. In most of the graphs, as one line slopes up, the other slopes down – EXCEPT in the 2020 election.
Interpreting the causes for these departures from previous elections calls for speculation. However, it does show that something different occurred in the 2020 election.
2020 Winners, Losers, and Combined Graphs
In the county graph files, you will also find 2020 Vote Winners, 2020 Vote Losers, and 2020 Combined graphs (some of which include the marijuana and gun issues). Each tells a story, and, collectively, they paint a picture. They tell what the voters had on their minds in 2020.
Vote Winners

This graph should cause you to ask a lot of questions.
Who was the Secretary of State running for the first time in an elected position? Why did the candidates in that position and the attorney general’s position garner more votes than the sitting president in his race for a second term and the former US Representative in his run for governor?
Why were the marijuana issues so important? – more important than the US Senate, the US House, the Governor races, and within 2,500 votes of Trump?
Why, in a state that is heavily in favor of the Second Amendment and has the most guns per household in the country, did Montanans believe that marijuana was more important than their gun rights?
As you look through the Winners and Losers graphs for the various counties, a curious pattern emerges.
Jacobsen got more votes than anyone else in 23 of the 49 Republican and mixed party counties, and the second most votes in 7 other counties. And, even though she lost in the 7 Democrat counties, in 2 of them she still got more votes than any of the other losing candidates. Knudsen, on the other hand, received the most votes in 12 counties and the second most votes in 25 other counties.
The team of Jacobsen-Knudsen or Knudsen-Jacobsen managed to secure the #1 and #2 spots in 22 of the 56 counties. They were in the #2 and #3 spots (behind Trump) in 6 other counties. It is surprising to see that these two state office holders received more votes in Montana than the sitting President of the United States, and all of the other candidates on the ballot.
Let’s look at a Vote Winner’s graph for one of 7 counties that went totally, Democrat.

The red dot in the upper left corner refers to the Keshel Heat Map:


Trump – 343,602 (56.92%) Biden – 244,786 (40.55%). Trump added 64k votes in 4 years, a GOP record, but curiously, Biden, while losing by 16.4%, gained 67k votes as the state registered just 58k new voters. Read more about Keshel’s Montana analysis here.
The dollar sign next to the red dot indicates that this county took Zuckerbucks (CTCL money). Read more about Montana CTCL funds received here.
Right away you may notice that a Democrat county had different priorities. Passing the marijuana issues had the highest priority here. Next was the US Senate and US House races. Oddly enough, the race for Superintendent of Public Instruction (Ed) garnered more votes than those for Governor, Attorney General, and Secretary of State – even more than that for Biden in his race for President.
The gun rights issue passed in the State by only 11,259 votes out of the 585,517 votes cast on the issue. One more “blue” county could have changed that result.
Vote Losers
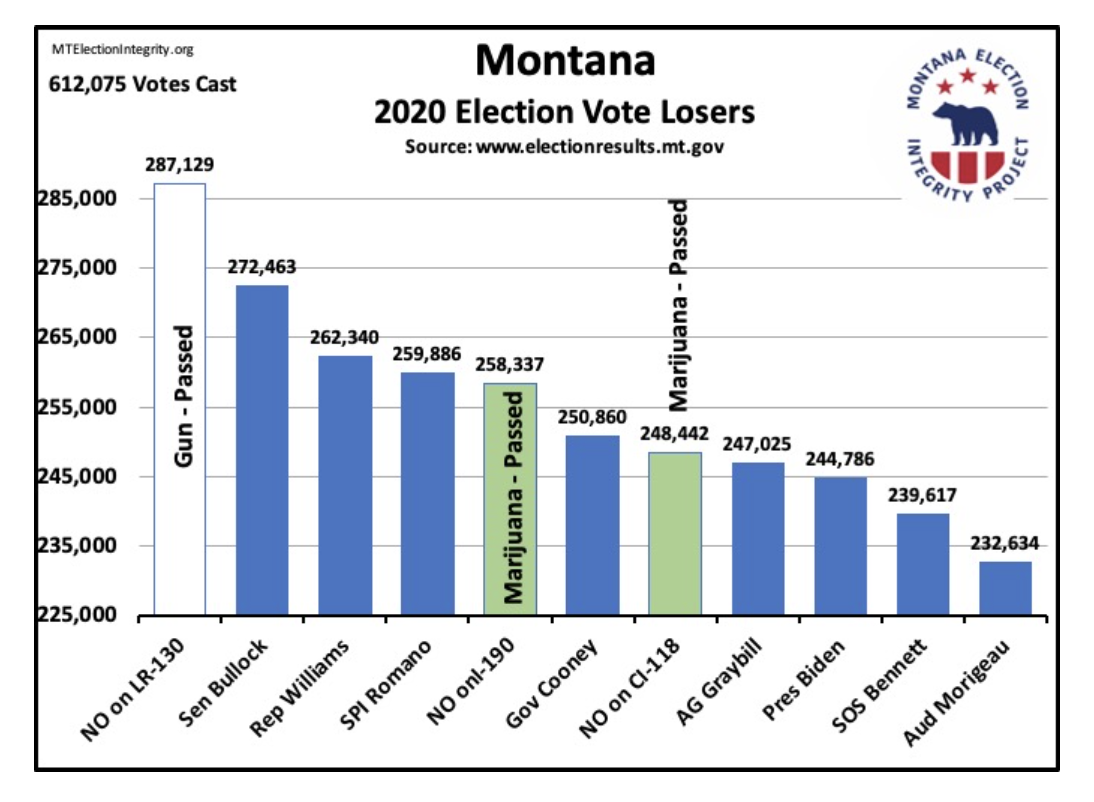
While Montana’s Winners graph focused on the Secretary of State, the Attorney General, the President, and the marijuana issue, Montana’s Losers graph emphasizes different concerns. The gun issue, even though it passed, was strongly contested – by Montanans who have the highest number of guns per household in the nation? As previously depicted in Missoula County’s Winners graph, the US Senate and US House races make a strong showing. And the office of the Superintendent of Public Instruction garnered more votes than those for Governor, Attorney General, and Secretary of State. And where’s Biden?
Combined Vote Winners, Vote Losers, and Ballot Issues

Combined graphs show the Winners and Losers, and the YES and NO votes on the issues. Note the differences in the YES and NO votes on the issues. It indicates that Montanans were strongly in favor of marijuana – but not so sure about their gun rights. Really?
30-Year Population and Election History graphs

As Montana’s population (blue line) has grown over the past 30 years, so has the population of people 18 years of age and older (orange line) – the voting-age population. When the Registered Voter data is plotted (gray line), anomalies can appear. In 2000, there were 24,554 MORE registered voters than there were Montanans of voting age. By 2002, at least 73,712 registered voters were purged from the records. Where did they go and who were they? Had they “voted” in the previous election?
A similar graph for Missoula County shows that registered voters EXCEEDED the voting-age population THREE times during this 30-year time span (1998, 2000 - hanging chads, and in 2006 – the Conrad Burns/Jon Tester race). In 2020, Missoula County showed a 95% voter registration rate. That is, 95% of the people in Missoula County over the age of 18 are registered to vote. This may be the highest in the State.
All of the Votes Cast in Presidential Elections (gold line) are also plotted here. Note the steep rise between the 2016 and 2020 Presidential races. From 2016 to 2020, Montana’s voting-age population rose by 38,994, and registered voters rose by 58,168, yet 95,174 MORE people are reported to have voted in 2020 than in 2016.
Registered Voters – February 2020 to May 2022

There are a few graphs showing the reported registered voter rolls on a linear timeline. The little squares on the line are actual data points.
The steep rise before the election and the decline after the election are most telling.
In this graph for the State:
Between Feb. 15th, 2020, and Election Day (Nov. 3rd, 2020), the voter rolls were increased by 65,784 – nearly 10%.
Just in the last 32 days (Oct. 2nd to Nov. 3rd), they rose by 33,272.
On Nov. 3rd, 5,317 names were added.
Following the election, the voter rolls began to be purged. From Nov. 4th, 2020 to June 6th, 2021, at least 24,635 names were taken off the list. Since then, the State has been increasing its voter rolls – now just 9,203 short of the Nov. 2020 high. Just in time for the June 2022 Primaries. It appears that the pattern continues.
Some of the graphs for individual counties show even more dramatic swings in registrations. Some of them even show a slight purge after the June 2020 Primaries. Perhaps this will occur again with the June 2022 primaries.
Other graphs and maps
Below, you’ll find other graphs and maps focusing on the CTCL funds, the marijuana and gun issues, and population changes that you might find interesting, if not useful.
Illegal Zuckerbuck (CTCL) funds were taken by 28 Montana counties.


